The Library · Insights
Deep dives across data, automation & AI
979 in-depth articles — from Excel foundations to production machine learning. Filter by topic or difficulty to find exactly what you need.
Microsoft FabricExpert
Optimizing Delta Table Performance in a Fabric Lakehouse: V-Order, OPTIMIZE, VACUUM, and Z-Order for Faster Queries and Smaller Storage
Delta tables don't optimize themselves. Learn how V-Order encoding, file compaction with OPTIMIZE, multi-dimensional data skipping with Z-Order, and storage reclamation with VACUUM work together to make your Fabric Lakehouse queries dramatically faster and cheaper to store. This lesson goes deep into the internals so you know exactly when and why to apply each technique.
32 min read
Power AppsExpert
Extending Model-Driven Apps with PCF Controls: Building and Deploying Custom Field and Dataset Components for Dataverse Forms and Views
Standard model-driven form controls hit a wall when you need genuinely custom UX — star ratings, card layouts, traffic lights, and more. This expert lesson walks you through building, testing, and deploying real PCF field and dataset controls from scratch, with full TypeScript implementations and production deployment patterns.
27 min read

PythonFoundation
Summarizing and Cross-Tabulating Categorical Data in pandas: value_counts, crosstab, and Percentage Breakdowns
Learn how to summarize categorical columns in pandas using value_counts() and build two-way contingency tables with pd.crosstab(). This lesson covers normalization, margins, and percentage breakdowns — the tools you need to answer "how is X distributed across Y?" questions quickly and correctly.
14 min read

Power AutomatePractitioner
Automating Multi-Application Workflows in Power Automate Desktop: Transferring Data Between Windows Apps, Web Browsers, and Excel in a Single Desktop Flow
Learn how to build a single Power Automate Desktop flow that extracts data from a Windows application, enriches it via browser lookups, and writes the results to Excel — with proper synchronization, error handling, and subflow architecture. This is the multi-application orchestration pattern that separates production-ready RPA from hobby scripts.
21 min read
Microsoft FabricPractitioner
Incrementally Loading Data into a Fabric Lakehouse with Watermarks and Pipeline Lookup Activities
Full table loads don't scale — and sooner or later every production pipeline needs an incremental strategy. Learn how to build a complete watermark-based incremental load pattern in Microsoft Fabric using Lookup activities, parameterized Copy activities, and PySpark notebook watermark updates.
20 min read
PythonExpert
Building a Reusable ETL Pipeline in pandas: Extract, Transform, and Load Data from Multiple Sources into a Clean, Analysis-Ready Output
Learn to build a production-grade ETL pipeline in pandas that extracts data from CSV files, Excel workbooks, and SQL databases; applies a layered transformation strategy; and loads results to multiple output formats. This lesson covers architecture, error handling, validation, and performance — the full picture for data professionals who need pipelines that actually hold up.
28 min read
Power AutomateFoundation
Working with Excel Ranges, Sheets, and Named Cells in Power Automate Desktop: Reading Tables, Writing Data, and Switching Worksheets Without Macros
Learn how to automate multi-sheet Excel workbooks in Power Automate Desktop without writing a single macro. This hands-on lesson covers reading tables, writing data to specific cells and ranges, navigating worksheets, and using named ranges to build flows that don't break when the spreadsheet changes.
16 min read
Microsoft FabricFoundation
Querying Lakehouse Data with the SQL Analytics Endpoint: Writing T-SQL Against Delta Tables Without a Warehouse
Every Fabric lakehouse comes with a built-in SQL interface that lets you run T-SQL against Delta tables — no warehouse required. Learn how to write queries, create views, join across tables, and connect from SSMS or Power BI, all against the same data your Spark notebooks write.
17 min read
Power AppsFoundation
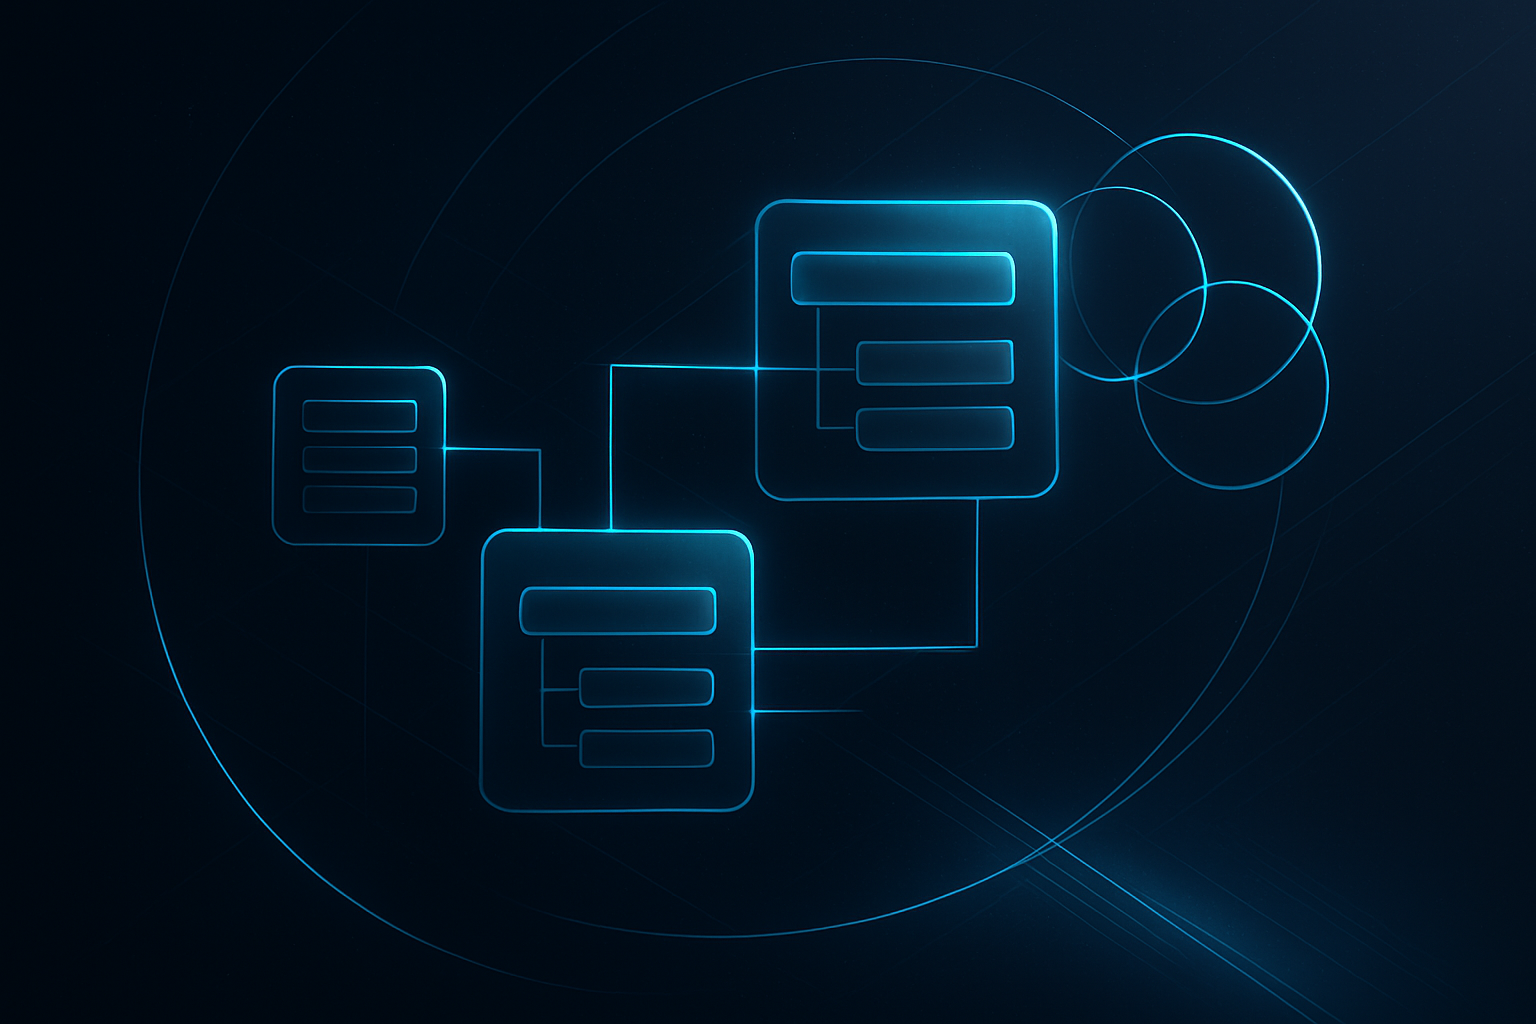
Configuring Dataverse Table Relationships in Model-Driven Apps: One-to-Many, Many-to-Many, and Cascade Behaviors Explained
Learn how to configure one-to-many and many-to-many relationships in Dataverse, understand cascade behaviors that protect your data integrity, and see exactly how relationships surface inside model-driven app forms. This is the structural knowledge every Power Apps maker needs.
18 min read

PythonPractitioner
Reshaping and Analyzing Multi-Level Data in pandas: Working with MultiIndex Columns and Rows After groupby and pivot_table
MultiIndex DataFrames from groupby and pivot_table are powerful but consistently confusing — until you understand the structure. This lesson teaches you to select, flatten, stack, and unstack multi-level data through a complete sales analysis project.
19 min read

Power AutomatePractitioner
Automating SAP GUI Interactions with Power Automate Desktop: Navigating Transactions, Extracting Table Data, and Handling Session Errors
SAP GUI holds critical enterprise data but predates modern APIs by decades. This lesson shows you how to drive SAP reliably with Power Automate Desktop — navigating transactions with scripting IDs, extracting full ALV grid datasets, and building session recovery logic that keeps unattended flows running without human intervention.
24 min read
PythonFoundation
Conditional Column Creation in pandas: Adding Calculated Fields with np.where, cut, and map
Learn how to derive new columns in pandas using three essential tools: np.where for conditional logic, pd.cut for numeric binning, and .map() for lookup-style translation. By the end, you'll be able to transform raw transactional data into analysis-ready features without writing a single loop.
14 min read